Basic idea:
Our database has over 20 columns such as %of Value , Value Per share, Debt% , 50 Day Moving Average%, 200 day Moving Average%, Revenue Growth Rates, Income Growth Rates, Revenue.
Each column is easily sorted by clicking on the very top of the column, columns can be sorted descending or ascending.
Industries can be clicked on to find similar stocks in the same industry.
ROE% Can click clicked on to find the highest ROE% in the database.

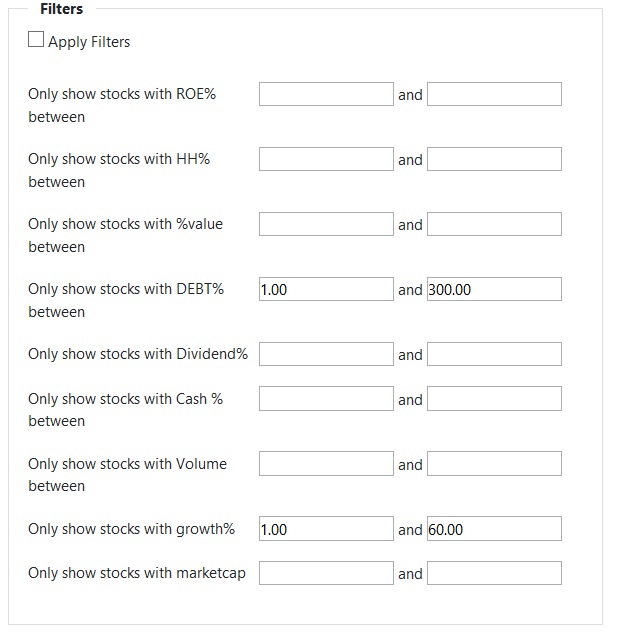
Filters
Filters, a very useful tool in our /database with over 5000 stocks, users can specify exactly what they prefer to see in companies. The filters can be turned on and off at will.

Saving Filters
You can also save various filters for next login or even have them emailed to you in the future. This allows you to save time without re-configuring every time you search the database.

Excluding Columns
Too many columns create eyestrain and problems for tablets, we have solved this problem by allowing users to hide certain columns, It works on smaller screen sizes now!
Hiding industry groups
Some industries are not fit to calculate for value, such as banks or asset management companies, they can disrupt the database view if they contain too much cash on hand or debt. We can easily hide certain groups to make the database more readable.
